We start by assisting our customers define their business goals and establish KPIs (Key Performance Indicators) that will be impactful to operations. With goals in place, we begin our Data Assessment by conducting interviews with the SMEs (Subject Matter Experts) and business owners of each process.
Clearly defining the objectives of each process, identifying data sources that contribute to calculations, and documenting business rules that need to be applied to final values, are the foundational steps of any database project.
Collecting representative data samples from the SMEs (Subject Matter Experts) allows our team to dive into the data and determine the best way to organize the information into logical groups, specify primary keys to uniquely identify records, and highlight dimensional tables. After normalization rules are defined, dimensional tables will serve as the links between data with multiple sources, but not necessarily identical terminology, nomenclature, or structure (Example: “A Bee Company”, “AB Co”, and “ABC” all are translated to “A Bee Company”).
After the data has been properly prepared, relationships are built between the fact tables containing the measures to be analyzed and the normalized dimensional tables.
While the architectural design puts the correct structure in place, the data warehouse is what gives the database life.
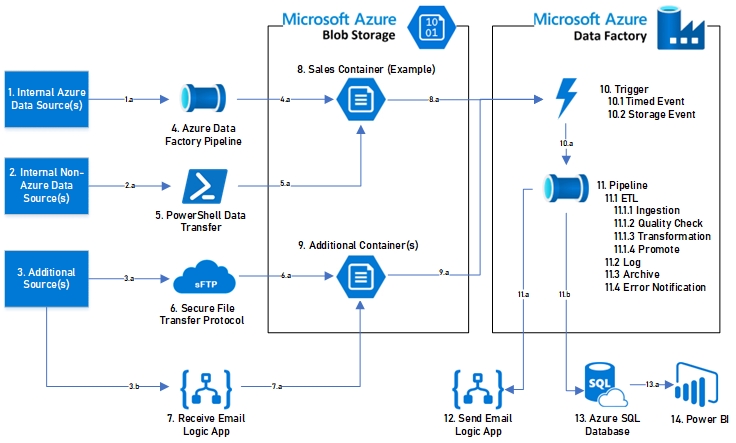
The first step in data orchestration is setting the frequency for the data extraction from each source. The frequency is set depending on the nature of the data. Where production data may come in hourly or daily, accounting data may come in as a part of the monthly book close process. Data with multiple sources are merged, correctly compensating for any differences in the number or names of fields.
Once the data has been successfully staged, quality checks are applied to each data feed to ensure there were no issues with the extraction from the source or any new exceptions within specific fields. After the data has been checked for accuracy, all business rules are applied, and the data is transformed to mirror the format of the production table. The last step of the process is to prepare the production table to receive the new records, then promote the transformed data into the production table.
If the database is the foundation of the application, logging and error handling are the mortar of the bricks. Each step of the process is logged, and when errors do occur, the development team is notified of the exact cause, which leads to the fastest possible resolution. Only data that passes through all the gates is promoted to production. It is better to favor having out of date information in the database versus inaccurate information.
While building the data warehouse is a key element to any reporting system, the database itself is just a repository. Data modeling is where all the information in the warehouse is linked together with logical joins and all of the measures and calculations are defined. Buidling the proper data model is what gives any visualization tool its speed, its ability to quickly pivot and filter data, and allows for impactful, dynamic analysis.
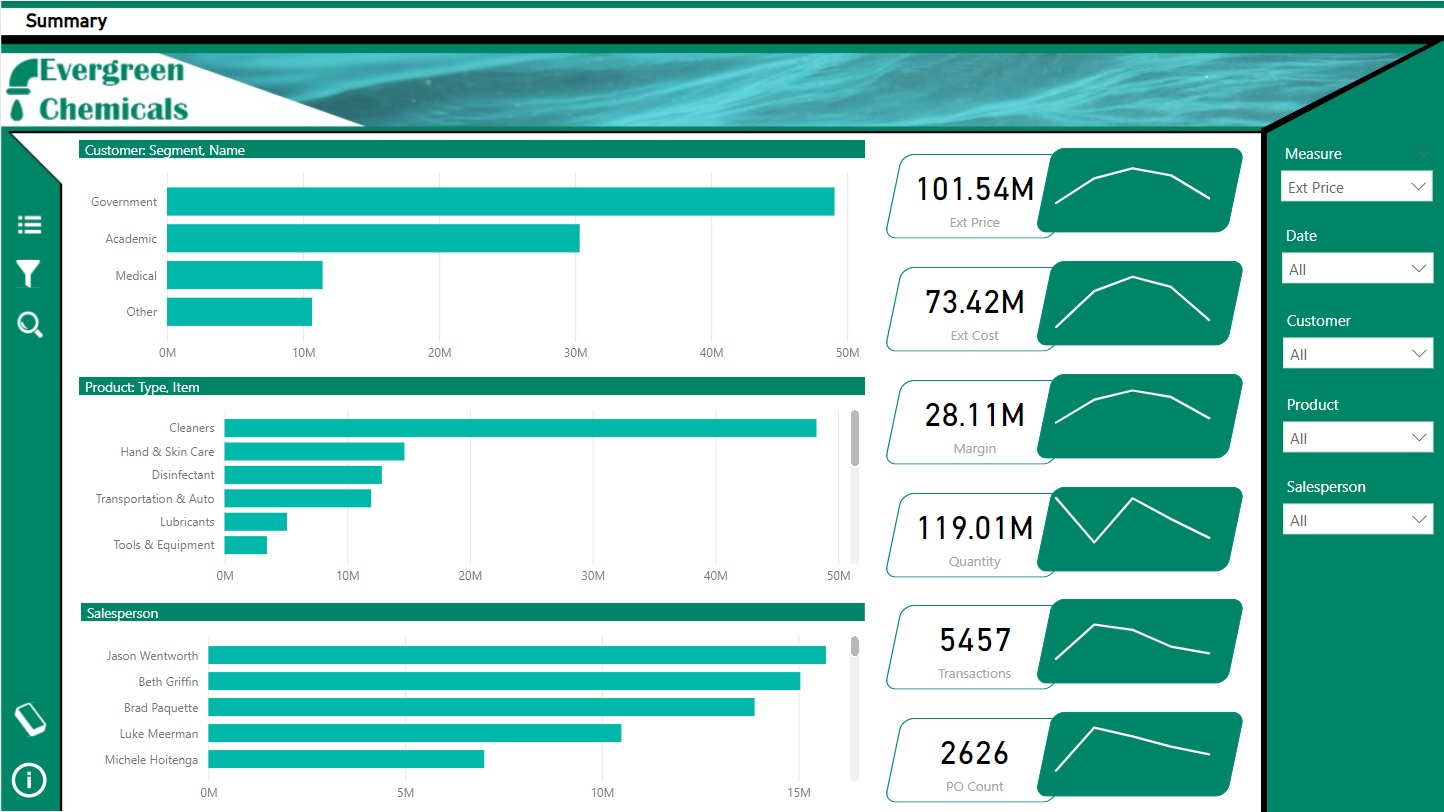
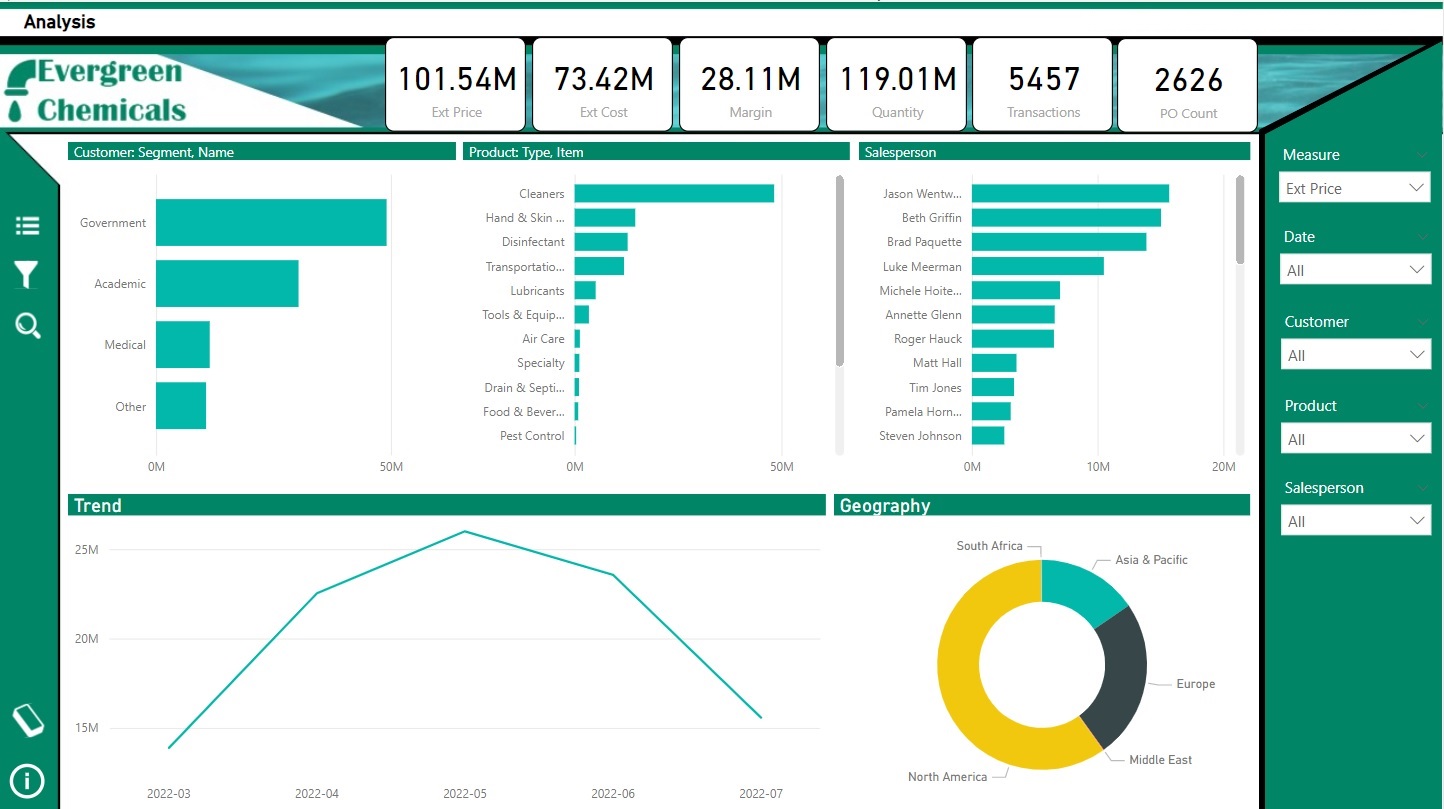
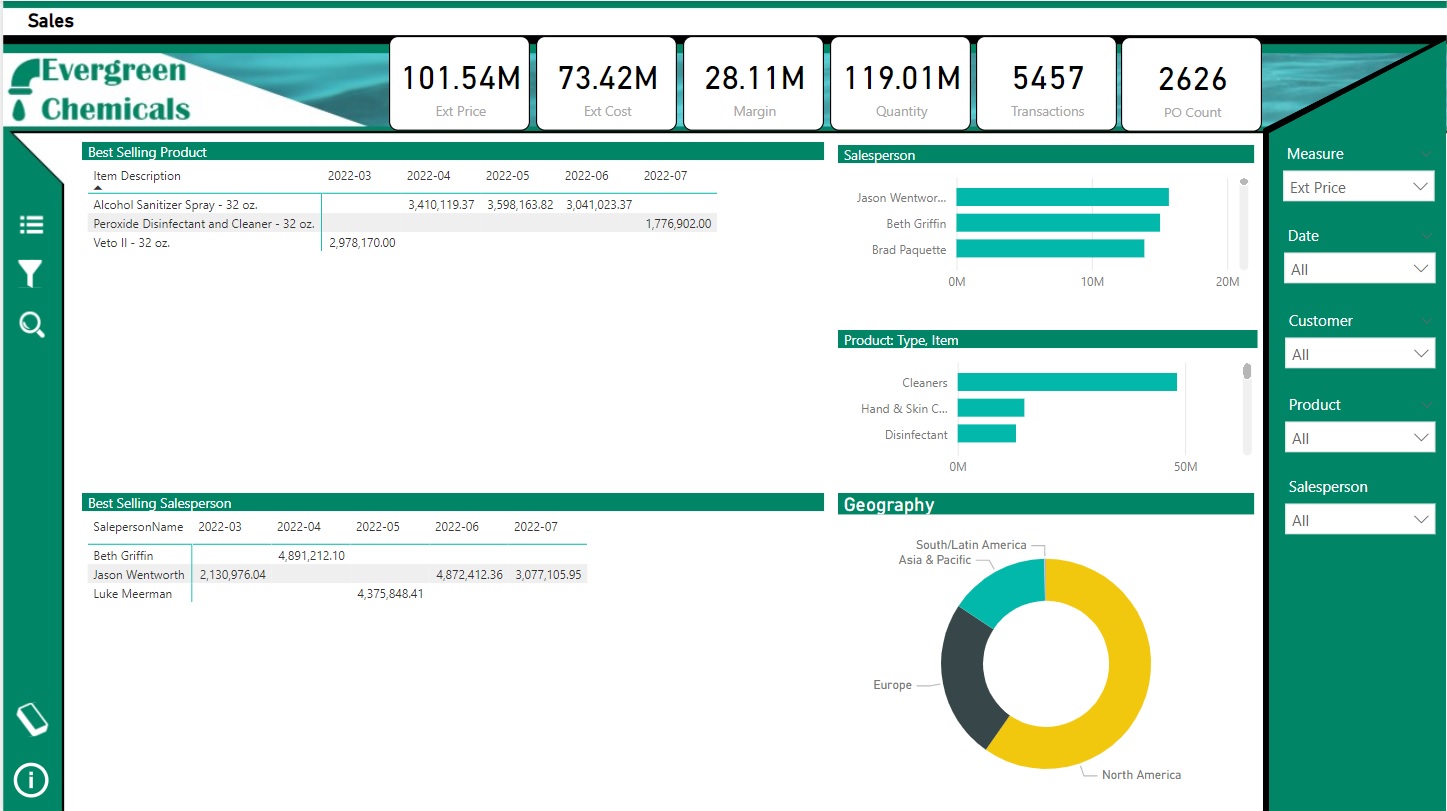
Its key to the project’s success to remember that the only interaction the users have with the data is through the reporting tool. Regardless of how elegant the database structure is, the users will not be well served if that data is not presented in a useful way in the final visualizations. Presenting the KPIs (Key Performance Indicators) that will help with day-to-day operations was established in the data assessment phase of the project, but the visualization phase is where that data is put to use.
Providing users with the ability to change measures being analyzed is a powerful way to provide insights and it leverages all the existing visualizations. With this methodology, users can quickly switch between gross sales, profit, quantity, or any other measure, all while viewing the same analytical dashboard.
Once reporting is in place, team members will quickly rely on its functionality. Having an ongoing maintenance plan in place is key to the continuous success of the data warehouse and reporting tool. Based on the frequency of the data, our system will automatically: check for data submissions to the system, perform logical quality checks based on historical trends, and archive data once it has aged out. Our developers will maintain the quality and functionality of the data warehouse, which allows our customers to focus on the final results.